by
by Latest Consumer Insights Now research explains why upholstery is such an important category among different age groups
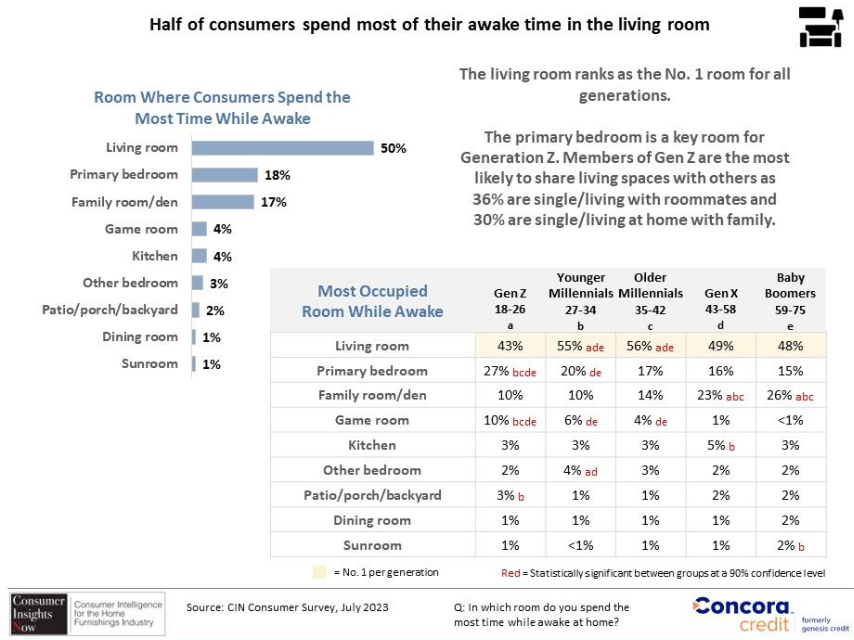
HIGH POINT — For many in the industry, it will likely come as no surprise that consumers spend most of their waking hours in their living rooms. This is true across age groups, from the youngest Gen Z consumers ages 18-26, to the oldest which happen to be baby boomers ages 59-75.
This also was a key message in this week’s installment of Consumer Insights Now, “Consumers Living at Home.” It describes how individuals and families live at home and what activities or hobbies they pursue in various rooms, including the primary bedroom.
Based on the survey results of some 1,877 consumers across the U.S. ages 18-75 and their spending plans for furniture in the second half, the living room was the most popular area of the home, with half of consumers spending the most time awake in that area. It was followed by bedroom at 18% and the family room or den at 17%.
The popularity of both the living room and the family room/den obviously explains the interest in upholstery among different age groups. It’s the main category of choice largely based on how people spend their time in the space. As we noted last week, some 39% of those surveyed said sofas and sectionals were the item they were most likely to purchase in the second half, followed by area rugs, 30%, and decorative accessories at 26%.
Those surveyed also describe how they spend time at home, with 79% saying they watch movies, 64% saying they listen to music and 44% saying they play video games. Other popular activities are cooking and baking, 41%; shopping online, 38%, and reading books, 37%. And the living room was the most popular area to watch TV or movies for more than half of those surveyed across age groups from 54% for Gen X and 62% for older millennials. Some 49% of baby boomers also said the living room was the most popular area to watch TV.
For watching TV, it was followed by the bedroom for between 19% (Gen X) and 28% (Gen Z), while the family room or den was the most popular area for watching TV for between 8% (Gen Z) and 25% (baby boomers) of those surveyed.
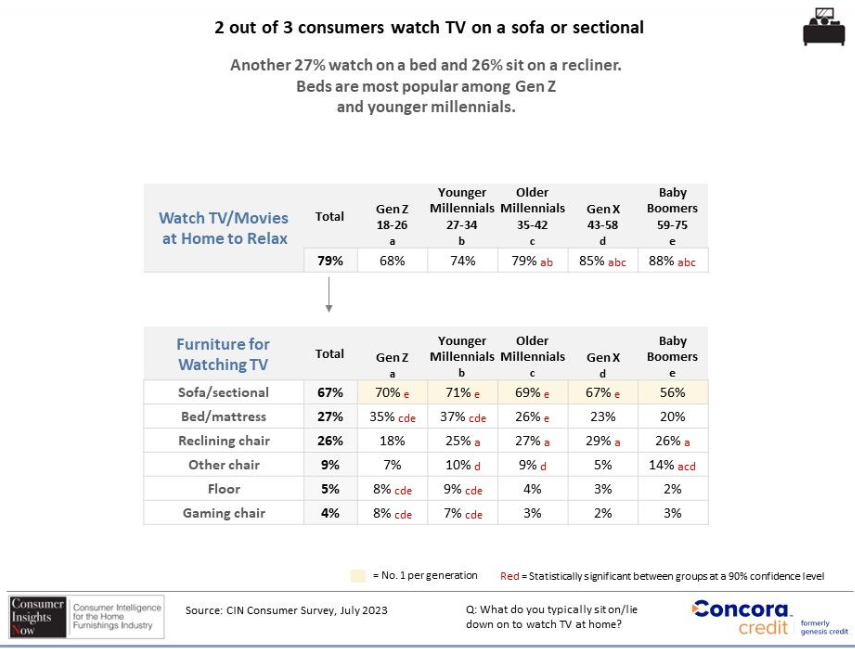
Thus it stands to reason that the sofa and/or sectional was the preferred furniture of choice for these consumers. Some 67% of those surveyed ranked it as the best category for watching TV, while 27% said the bed/mattress. Some 26% of those surveyed said a recliner was the best piece of furniture to watch TV.
Playing video games was another hugely popular activity, with 43% of respondents playing games most often in the living room. The next highest number of respondents, 25%, played video games most often in their bedrooms, while another 13% said the family room and another 12% said a dedicated game room.
Sofas and sectionals were the most popular furniture item used for gaming (chosen by 45% of respondents), followed by the bed/mattress, 24%, a reclining chair, 23%, and a gaming chair, 21%.
The survey noted that some 20% of respondents plan to buy a recliner between now and the end of the year. This ranged from 18% among both Gen Z consumers and baby boomers to 20% for Gen X consumers, 21% for younger millennials and 22% for older millennials.
Other highlights of the report were as follows:
+ Three of four consumers plan to buy a recliner in a physical store, compared to a quarter of those surveyed who plan to purchase one online. Younger millennials and Gen Z consumers are most likely to purchase their recliner online.
+ Some 42% of those surveyed said they would probably make this purchase at a large, national furniture store chain, while 18% said a local or regional furniture store. Some 15% said they would make this purchase at a big-box retailer.
+ Another 8% and 3% said they would purchase a recliner on Amazon and Wayfair, respectively. Another 3% said they would purchase it from a designer.
+ Nearly 4 of 10 surveyed said they plan to spend more than $750 on a recliner, compared to 23% who said they would spend from $500 to $749 and 21% who said they planned to spend $300 to $499 and 17% who said under $300.
+ More than half of those surveyed plan to purchase a power recliner, while 35% said they plan to buy a manual recliner. The remainder said they were not sure.
+ Some 77% of those surveyed said they were replacing an existing recliner. The overall score was 73% or higher for the various age groups surveyed.
Other areas covered by the survey include leather and fabric preferences, preferred functional features, and colors sought in the recliner category.
Working at home was another area covered by this week’s survey, but we will dive deeper into that subject in a follow-up to this article.
As always, we hope the information is particularly useful to our retail readers as they shop for new product during the fall market cycle and merchandise their floors for the fall selling season. With such data in hand, we believe the industry will have a better understanding of how consumers live at home and what products will likely best suit their needs.
Below is the full schedule of the five installments of CIN. Click the links of the published reports to access the complete data.
+ Sept. 11 — Purchase Plan Overview July 2023 to December 2023
+ Sept. 18 — Consumers Living at Home (A look at how and where people spend their waking hours at home)
+ Sept. 25 — Dining and Entertaining at Home (A look at where people dine in the home and to what extent they entertain at home)
+ Oct. 2 — Home Design Report (preferred consumer style preferences and more)
+ Oct. 9 — Furniture Shopping and Buying Influences (what is driving consumers’ desire to buy furniture and how retail plays a role in that process)