Latest installment of Consumer Insights Now addresses the types of furniture people want to spruce up their homes for guests
HIGH POINT — With the fall season upon us, we turn our thoughts to the upcoming holiday season and the time people spend dining and entertaining at home. It’s also the subject of this week’s installment of Consumer Insights Now, “Dining and Entertaining at Home,” the results of which we published this past Monday.
In summary, the survey polled nearly 1,900 consumers representing a wide mix of ages and ethnic backgrounds around the U.S. between late June and the first week in July. The goal was to see what types of furniture people planned to buy between July through December.
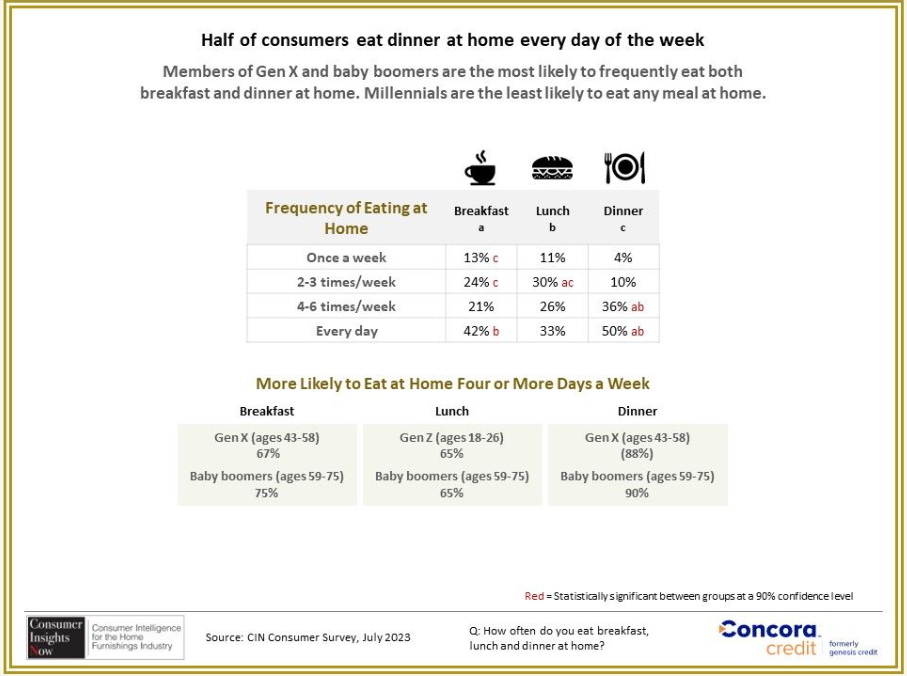
In this particular segment, our research expert Dana French asked consumers where they eat meals and where they entertain. As expected, the survey found that most eat meals in the dining room and kitchen. But many under age 35 said they are most likely to eat in the living room. The survey also asked respondents about how often they dine at home and broke this down further by various meals as shown in the graphic below.

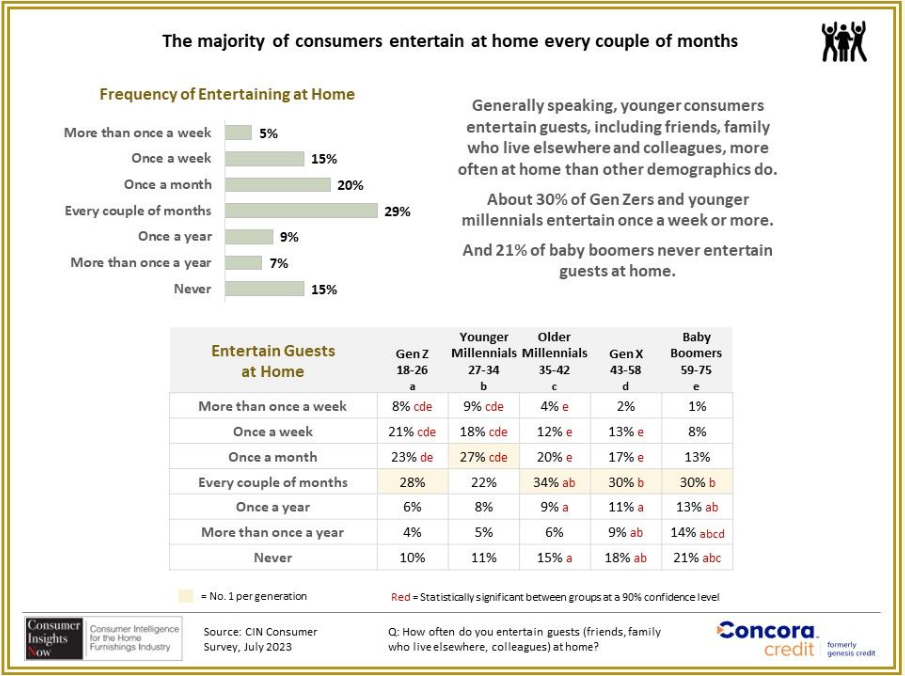
It also noted that nearly 40% of those ages 35 and under entertain once a week compared to the 21% range for Gen Xers (ages 43-58) and baby boomers (ages 59-75) combined and 12% for older millennials (ages 35-42). Perhaps due to family obligations including children and grandchildren occupying their time, they are more likely to entertain every couple of months.
Casual get-togethers were the main reason for entertaining for 65% of those surveyed followed by holiday gatherings (47%), cookouts and barbecues (44%) and birthday parties (36%). Dinner parties followed at 26%; movie nights, 25%; and sports-watching gatherings, 23%.

Another key takeaway was that regardless of how often you have people over, some two-thirds surveyed said that a well-decorated home is important for entertaining. Thus, it also helps to know that for 72% of those surveyed, the living room was the most important room for entertaining, followed by the dining room (36%) and the kitchen (34%), and the patio, porch or backyard (28%) and the family room (24%).
National furniture store chains were the top brick-and-mortar shopping destination for 44% of those surveyed, followed by local/regional furniture stores (17%) and big-box retailers (12%). Amazon was preferred by 10% of those surveyed, followed by 7% who said they were unsure and 5% who said Wayfair. About 3% said they would buy dining with the help of a local designer.
Other key takeaways from the survey were as follows:
+ About 14% said they planned to spend between $1,000 and $1,999 on dining room furniture, while another 14% said they planned to spend between $750 and $999. Another 7% said they planned to spend between $2,000 and $2,999, and 6% said they planned to spend more than $3,000.
+ 12% said they planned to spend between $500 and $749 and a combined 47% said they planned to spend between $300 and $499, thus highlighting the importance of promotional price points.
+ Between 83% and 85% respectively said that a dining table and dining chairs were the main items they planned to purchase, followed by a China cabinet (15%) and a buffet and sideboard, 12% and 10% respectively.
+ The largest number, 43%, said they planned to buy a table and chair set that seats four to five comfortably, followed by 31% who said they planned to buy a dining set with a table that seats six comfortably. Another 14% said they planned to buy a table that seats seven to eight comfortably, while only 3% said they want a table that seats more than eight. Another 9% said they want a table that only seats two or three.
+ 53% of those surveyed said they want a coordinated dining set, while another 34% said they want mix-and-match pieces, with the remainder saying they weren’t sure. Those wanting mix and match were mostly under age 35, while those who wanted a coordinated set were older than 35.
Other areas of interest include preferred wood tone finishes, how people plan to pay for/finance their purchases and the amount of time that consumers expect to wait for their dining furniture. The survey also looks at preferences by region, giving retailers an idea of what customers might be seeking in their respective markets.
As always, we hope this proves to be useful information not only as you shop for furniture during the fall market cycle, but also in how you merchandise your sales floor in the coming weeks and months.
Below is a synopsis of the reports we have run thus far and what’s coming up in the next couple of weeks.
+ Sept. 11 — Purchase Plan Overview July 2023 to December 2023
+ Sept. 18 — Consumers Living at Home (a look at how and where people spend the most time at home)
+ Sept. 25 — Dining and Entertaining at Home (a look at where people dine in the home and to what extent they entertain at home)
+ Oct. 2 — Furniture Shopping and Buying Influences (what is driving consumers’ desire to buy furniture and how retail plays a role in that process)
+ Oct. 9 — Home Design Report (a detailed look at consumers’ preferred style preferences)


